You are here
Quality Improvement Plan
Background A shared Quality Improvement Plan (QIP) has been developed nationally in response to concerns raised through:
1. Health Education England’s data reporting
2. Concerns raised by learners
3. Medical Workforce Race Equality Standard report
4. HEE Call for Evidence on best educational practice
The QIP addresses EDI concerns for all learners including Postgraduate Medical and Dental Education (PGMDE). For doctors the availability of the Medical Workforce Race Equality Standard (MWRES) has been very helpful. It clearly articulates the actions and core deliverables required to measure progress and impact to ensure PGMDE is delivered with a greater focus on EDI, and what actions may be required at specific stages of a doctor’s career.
Approach
The HEE Quality Framework has provided two excellent tools, namely the National Education and Training Survey (NETS) and Provider Self-Assessment (SA). The former providing measures of learner satisfaction, available opportunities, and the frequency of bullying and harassment, and the latter providing an understanding of the actions being taken to address any emerging concerns.
Further QIP Actions for Year 3 (2023/2024)
1. Review the EDI metrics that have been collected in Year Two of the QIP implementation and agree what should be developed as business as usual.
2. Ensure the relevant metrics are shared with Regional Teams so they can carry out further data analysis and triangulate with local initiatives with an EDI theme. Agree actions based on their local requirements.
3. Further actions for the QIP will be based on the conclusions and findings in this report. The QIP will be refreshed as an action for national and local offices to focus on themes and work streams related to EDI.
4. Work with NHSE colleagues to incorporate relevant metrics in the EDI Workforce Plan.
5. An ongoing commitment to making EDI data available from across our work meaningful, accessible and develop a business-as-usual data collection plan.
National Education and Training Survey (NETS)
The 2022 NETS recorded the highest number of responses to date with nearly 40,000 learners taking part and sharing their experience. The results describe a challenging situation for our learners with increased levels of stress, burnout and feeling overwhelmed. The number of learners experiencing bullying and harassment has increased and goes largely unreported. A number of learners reported experiencing discrimination by patients but often did not wish to report their experience to their education or placement provider.
New for 2022
- An additional set of questions was added for all learners: about whether learners felt they had experienced discrimination by patients, whether they reported it and if so, whether appropriate action was taken.
- We also included additional questions about the availability of wellbeing support and whether this supported those who needed it.
- In 2022 we included specific questions for most professional groups. For example, we asked postgraduate medical doctors whether they had received clear information about out of programme options. These specific questions are not included in the analysis used in this report.
- To prepare for this report, we have joined four years of NETS responses so that trends and themes can be identified. The core question set in NETS remains unchanged and so enables year-on-year comparisons.
The Focus of NETS and NETS Reporting
The NETS survey and the reports produced from it are a key operational part of the HEE Quality Strategy, designed to help us test a number of hypotheses:
• Do our learners experience high quality learning, as defined in the HEE Quality Standards and Framework?
• Are there any groups of learners, at national, regional and local levels, that appear on average to have a particularly good educational experience, and any others that may need additional support in line with the Quality Framework?
• Can we identify changes and trends in healthcare learners’ experiences of education and training? (As we now have four years of NETS data, we are now able to present these trends as part of this report.)
From an EDI perspective, we need to consider these points in terms of the main protected characteristics:
• age
• sex including gender reassignment
• disability
• race (including ethnicity and nationality)
• religion or belief
• sexual orientation
Source: Discrimination (www.gov.uk)
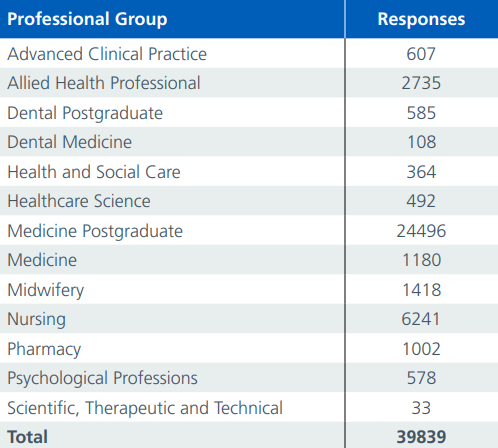
We do not routinely ask about marital status or pregnancy, so we are unable to include these two characteristics, but we aim to do so for NETS 2023. NETS currently asks about Country of Origin but not Country of Qualification. This will also be considered as we continue this work. This year there were nearly 40,000 responses from 12 different professional groups.
Characteristics of Learners
Whilst we are working with data from respondents rather than the entire population of learners, with NETS we have a reliable estimate of the proportion of demographic groups represented in the wider learner population.
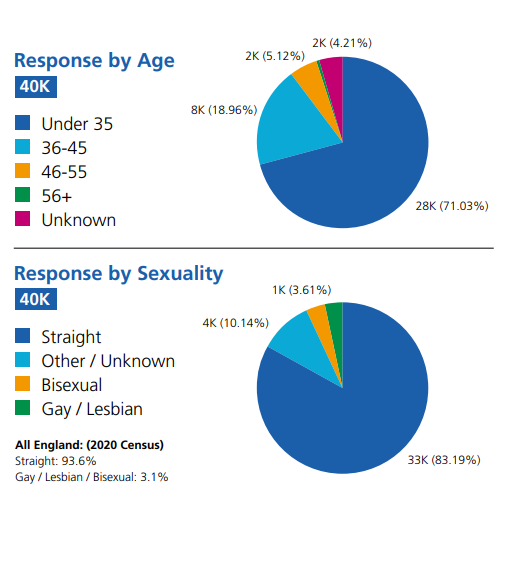
Age: Most learners are under 35, but not exclusively so: 271 respondents are over 56.
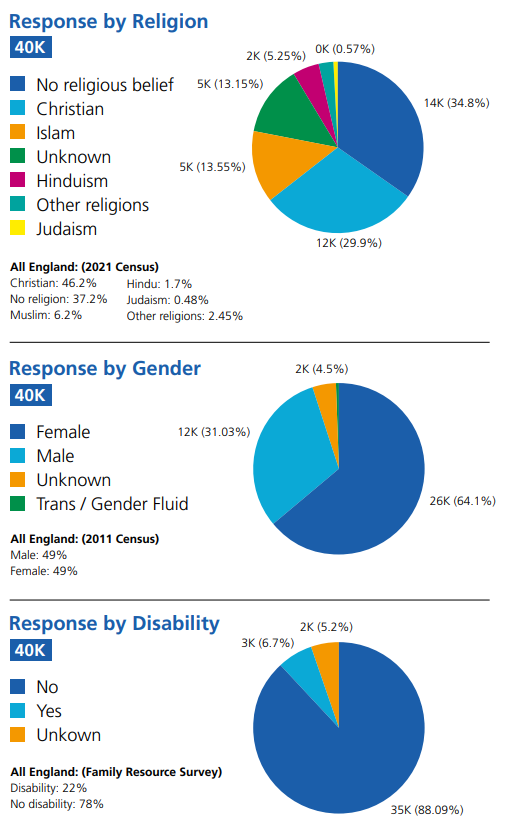
Gender: There are more female learners (64%) than male overall. This rises to 85% female (Nursing) 98% female (Midwifery), 79% female (Pharmacy) 71% female (Healthcare Science). Postgraduate medicine had the highest proportion of male respondents, at 40%. Transgender learners account for 0.37% of learners (estimated at 0.1% to 0.6% worldwide)
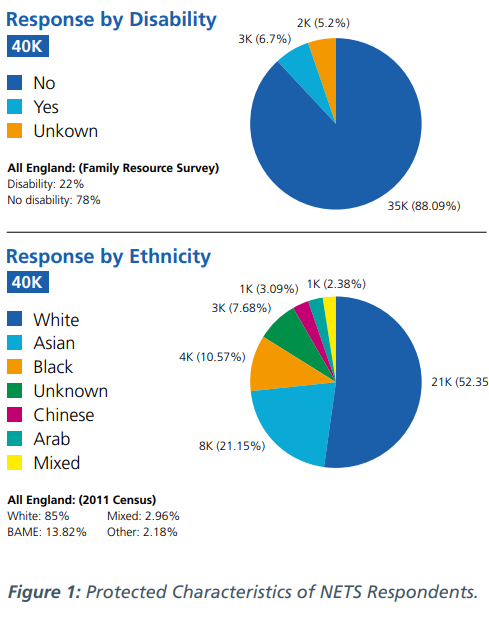
Disability: Learners with a disability represent just 6.7% of NETS respondents, somewhat lower than the estimated UK average of 22%. It is likely that many will have a disability in the medical sense, but do not feel the need to report this to work as the disability in question does not impact on work and does not require additional support or adjustments.
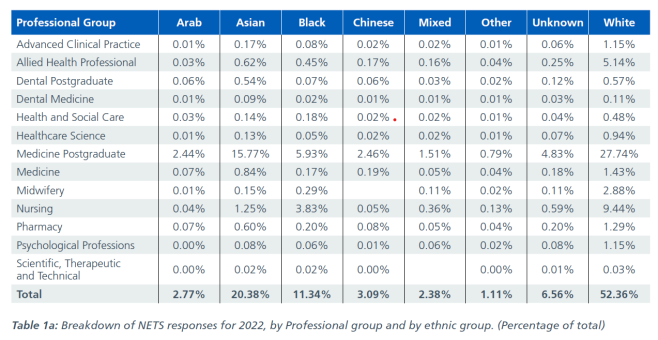
Ethnicity: For ethnicity, the number of White learners is 52%, compared to 85% in the general English population. The number of Black (10.5%), Asian (21.1%), Chinese (3%) and Arabic (2.4%) learners all suggest that these groups are well represented within health education and training.
Religion: “No religious belief” is the most common response at 34.6%, followed by “Christian” at 29.9%. Islam is well represented amongst learners (13.5% of learners compared to 6.2% of the population) as is Hinduism (5.25% compared to 1.7% in the population).
Sexuality: 7.2% of the learner population describe themselves as gay, lesbian or bisexual, which is double the proportion in the UK Census (3.1%).
The ‘Unknown’ Learner
A sizeable proportion of respondents were happy to answer most of the NETS questions about their education and work experience but did not wish to divulge details about their protected characteristics. What is interesting from the data shown in the NETS charts in the section below, is that the ‘unknown’ group is very often the group with the lowest opinion of their education and training. Nationally, these ‘unknowns’ are not small groups: they represent between 5-12% of respondents, depending on the characteristic in question. We need to explore ways to better understand and engage this group, encouraging survey completion and the raising of concerns so action can be taken.
Looking at Trends in NETS data 2019-2022
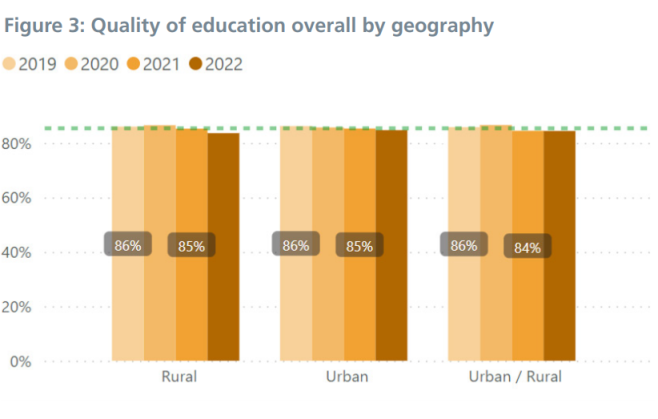
Each of figures 4-8 below looks at trends in NETS data. Each page illustrates a different question, the first being:
How would you rate the quality of education overall in your current placement?
Responses from each of the protected groups are shown in different colours, with the lighter colours representing the earlier surveys and the darkest colours the most recent (2022).
Each bar shows the number of positive responses (“Outstanding”, “Good” and “Satisfactory” in the figure 4) as a percentage of all responses.
Quality of Education Overall
Whilst we are working with data from respondents rather than the entire population of learners, with NETS we have a reliable estimate of the proportion of demographic groups represented in the wider learner population.
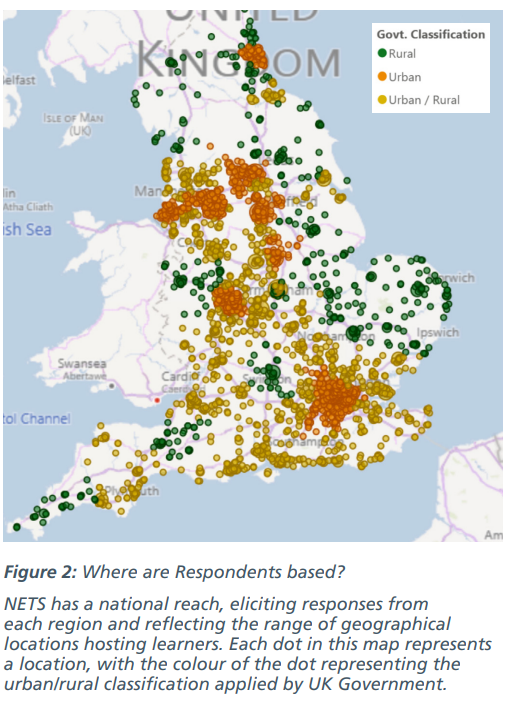
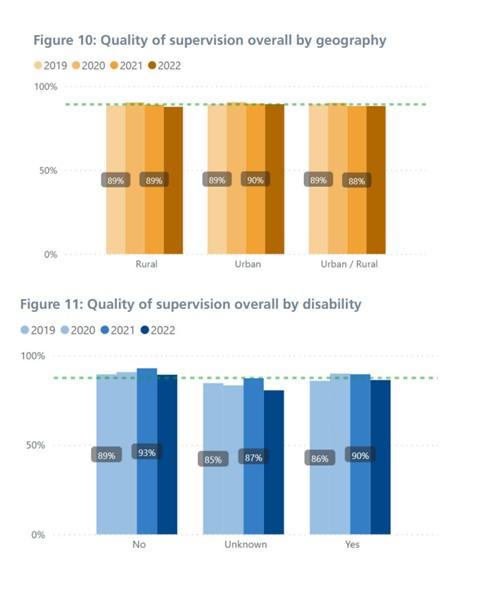
We use the Government’s geography data to categorise each provider location in NETS. There appears to be no overall difference between the experience of urban and rural learners, although there may be differences apparent within specific regions or professions. Our approach to NETS allows it to be explored at regional, ICB or programme level.
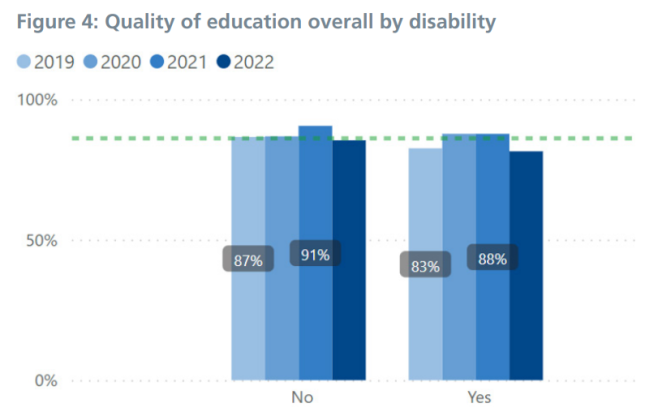
There is a clear difference between the ratings from learners with a disability, and from those with no disability. This is most apparent in the data from 2022 (the darkest blue shade). There is also an ‘n-shaped’ trend to this data over the four years we have collected NETS.
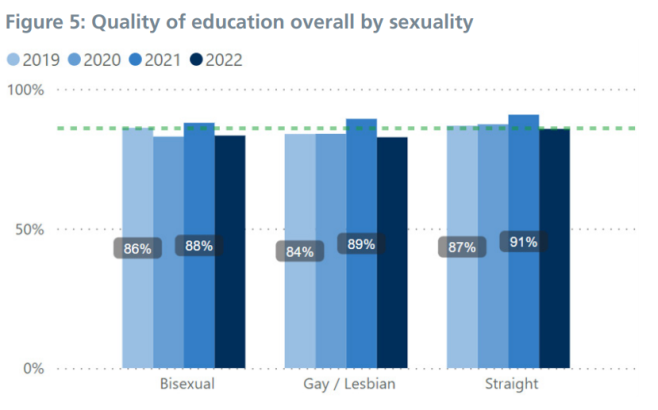
For sexuality, ratings from bisexual, gay or lesbian learners are less than the average (green dotted line). 2021 looks to be a high-point in the overall experience of learners, and also shows a more equitable experience across the different protected characteristics
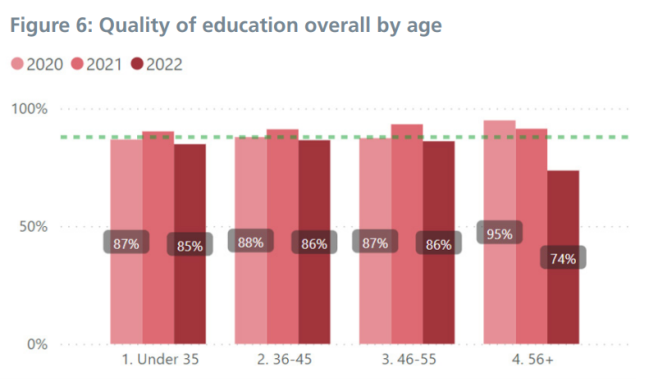
There appears to be little difference to the overall experience by age.
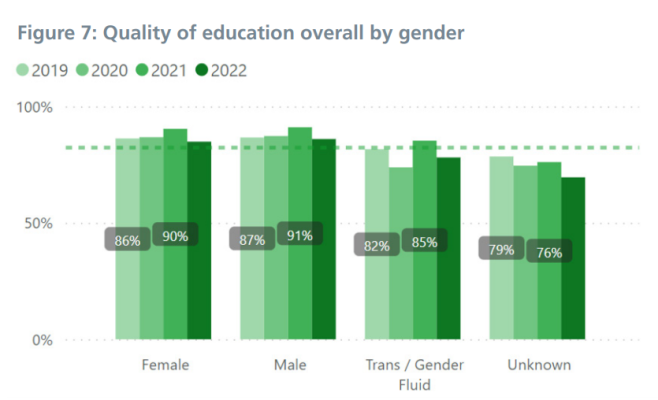
As described in the section “The Unknown Learner” above, our NETS data often shows that the groups reporting the lowest ratings do not wish to disclose any aspect of their identity.
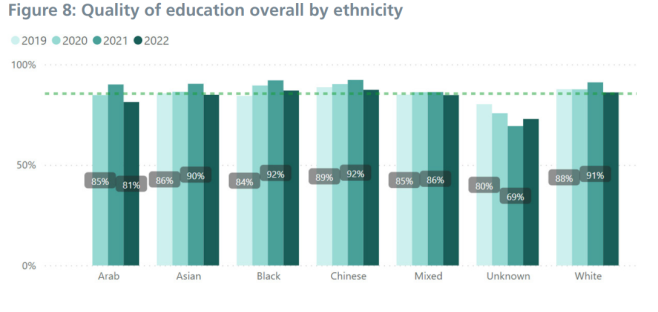
The results by ethnicity show that Arab learner’s ratings are much lower than White or Chinese colleagues. 2021 was not as good a year for those whose ethnicity is unknown compared to all other colleagues.
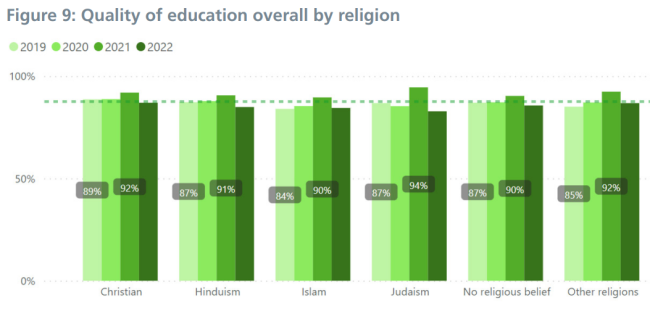
While each of these blocks shows the same improvement-then-decline trends, there appear to be few obvious differences between them. The results by ethnicity show that Arab learner’s ratings are much lower than White or Chinese colleagues. 2021 was not as good a year for those whose ethnicity is unknown compared to all other colleagues. Figures 3-9: Quality of Education Overall %age responding “Outstanding”, “Good” or “Satisfactory”) Dotted green line shows the national average, over all years. [NETS 2019-2022 data, all England]
Quality of Supervision Overall
In this section, we look at responses to the question:
“How would you rate the overall supervision you received in during the practice placement or training post?”
The same ‘n-shape’ is visible in many of these charts, reflecting 2021 as a good year from the learner’s perspective.
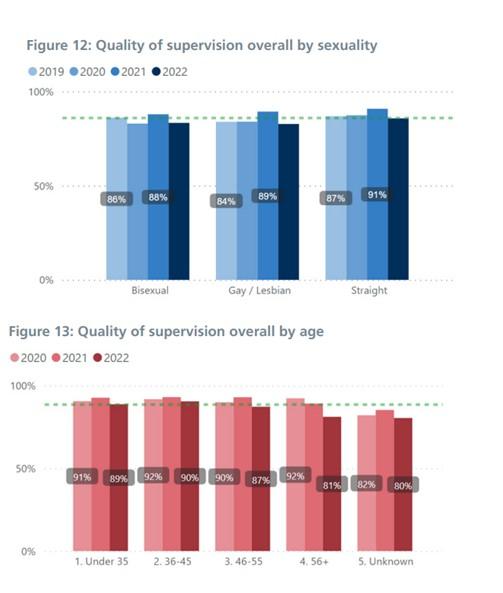
Ratings for supervision can be seen to decrease slightly with age. The ‘unknown learner’ factors described above is clear in this chart too.
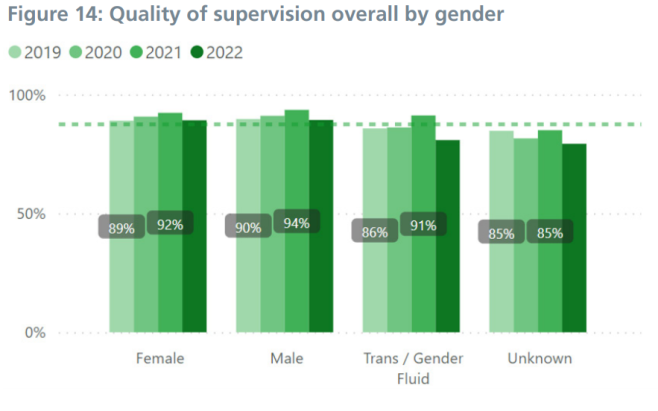
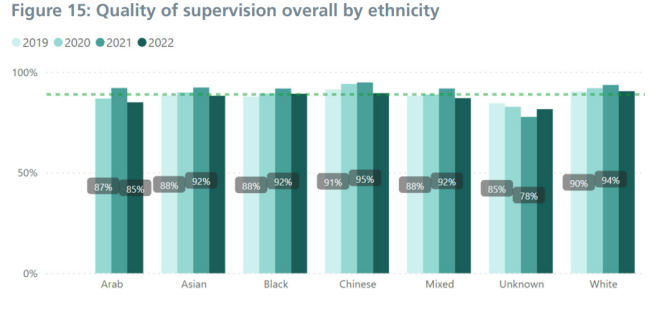
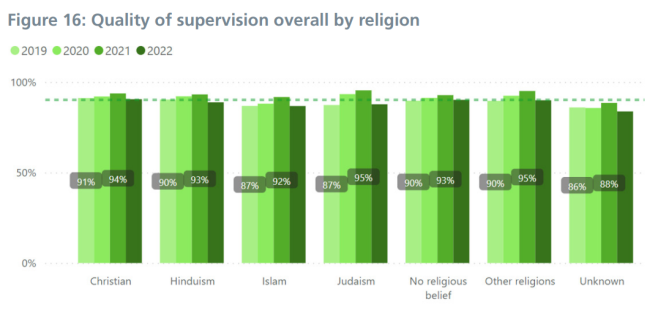
Figures 10-16: Quality of Supervision Overall. (%age responding “Outstanding”, “Good” or “Satisfactory”) Dotted green line shows the national average, over all years. [NETS 2019-2022 data, all England]
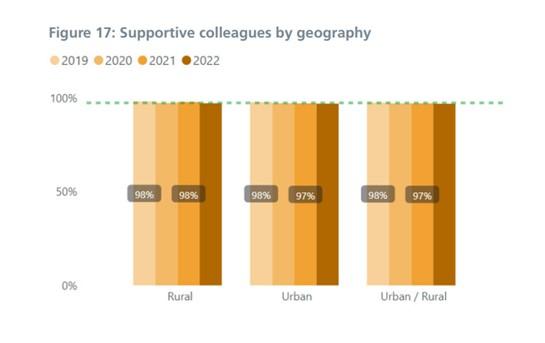
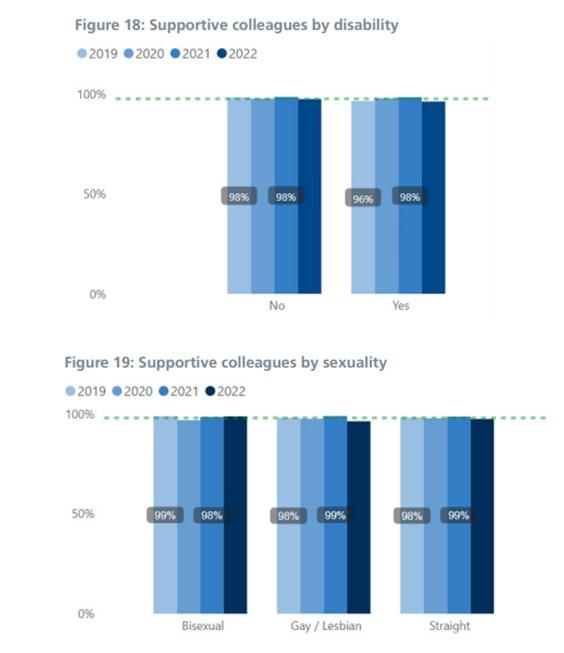
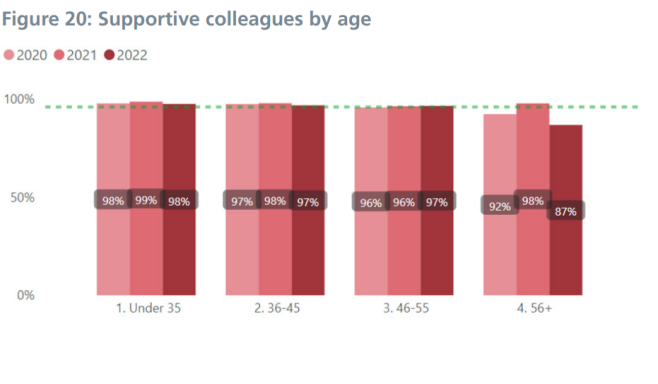
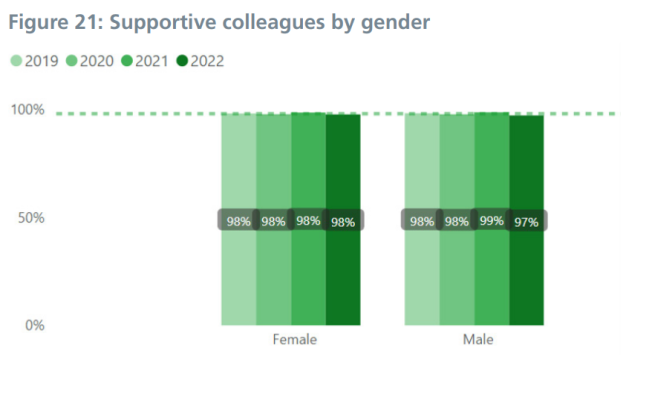
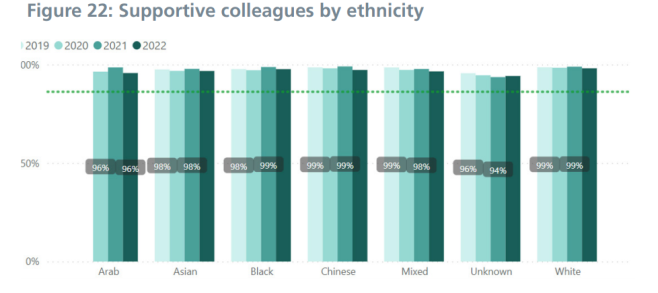
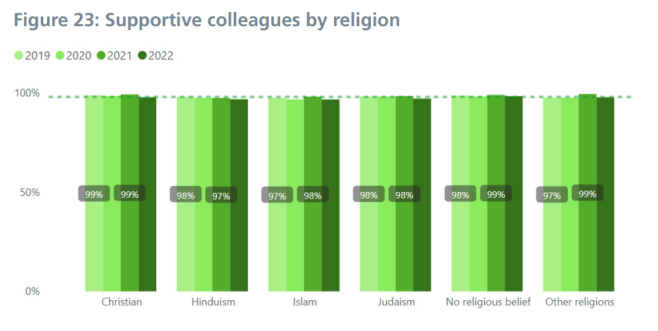
Are Colleagues Supportive?
In this section, the charts focus on the responses to the question: “How often were staff welcoming, supportive and friendly throughout the placement?”
The charts show the percentage responding with “Always”, “Often” or “Sometimes”. The results in this section are very high compared to others: most learners find their working colleagues supportive and friendly. This is true across the demographic groups – all of the different groups by disability, sexuality, gender, ethnicity and religion benefit equally from the support of their colleagues.
The exception may be age, as learners seem to rate the support they get less highly the older they are. Despite the differing experiences of supervision, bullying and discrimination, our learners feel good support from staff in general, whoever they are. Learning environments should take pride in this and organisations should celebrate and support their friendliest, most welcoming departments.
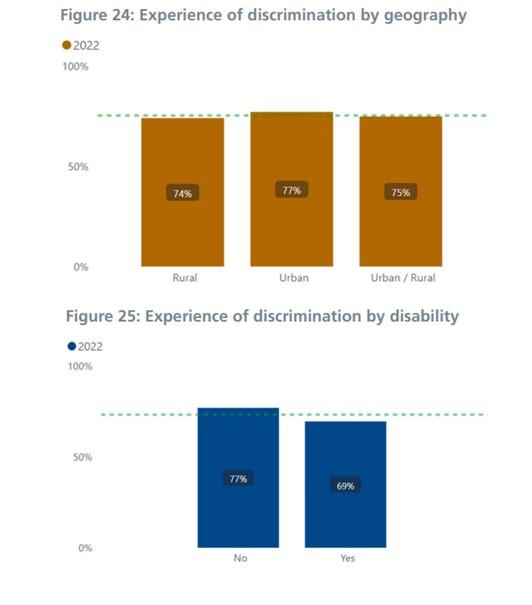
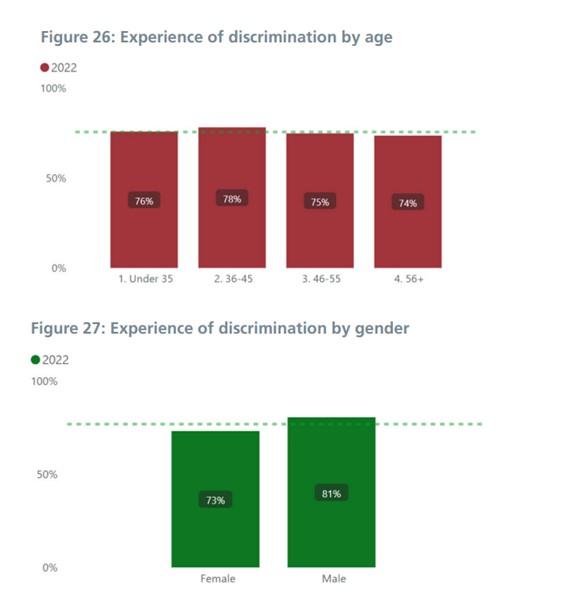
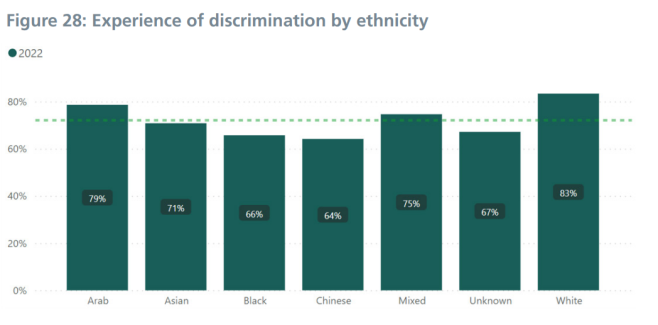
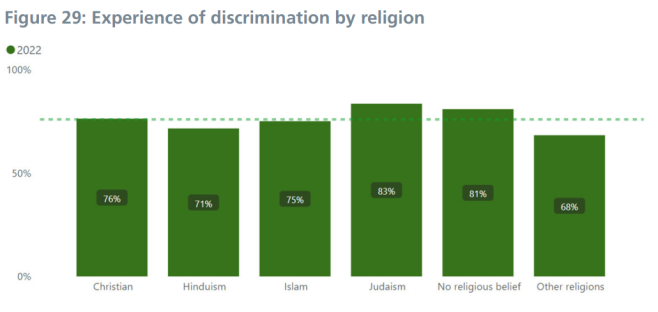
Have You Experienced Discrimination By Patients?
This section considers responses to the NETS question “Have you experienced discrimination by patients?” and the charts show the percentage of respondents who said “no discrimination”.
Every demographic group included experienced some level of discrimination by patients. As we haven’t asked “Was the discrimination you experienced directed towards you”, we can’t be certain whether different demographic groups are more likely to personally experience discrimination, or whether they are more likely to witness it.
In either case more discrimination was reported by learners with a disability, who are female, bisexual, gay or lesbian, or of a specific ethnicity or religion.
The NHS offers guidance to nursing leaders on patients discrimination:
https://www.england.nhs.uk/publication/combatting-racial-discriminationa...
The BMA provides similar guidance for doctors: https://www.bma.org.uk/media/5144/bmaguidance-on-how-to-deal-with-discri... Figure 26:
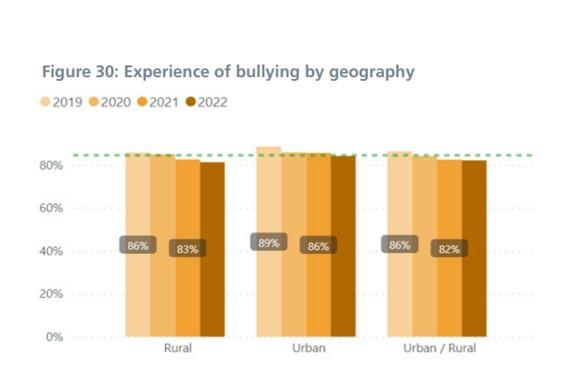
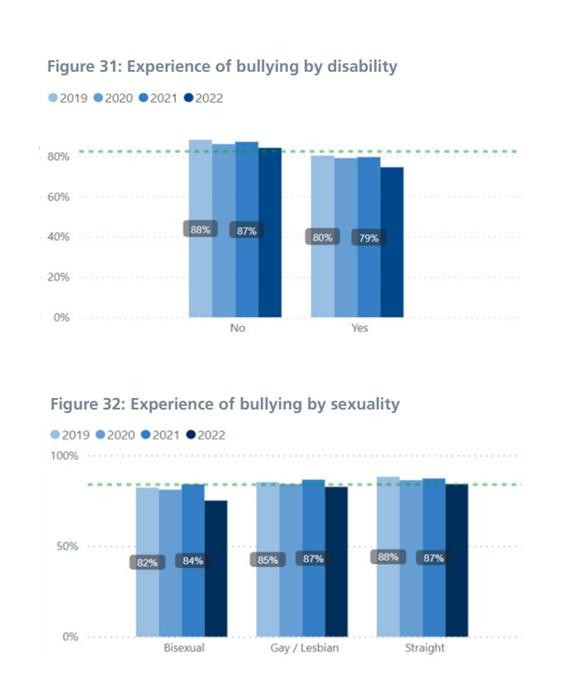
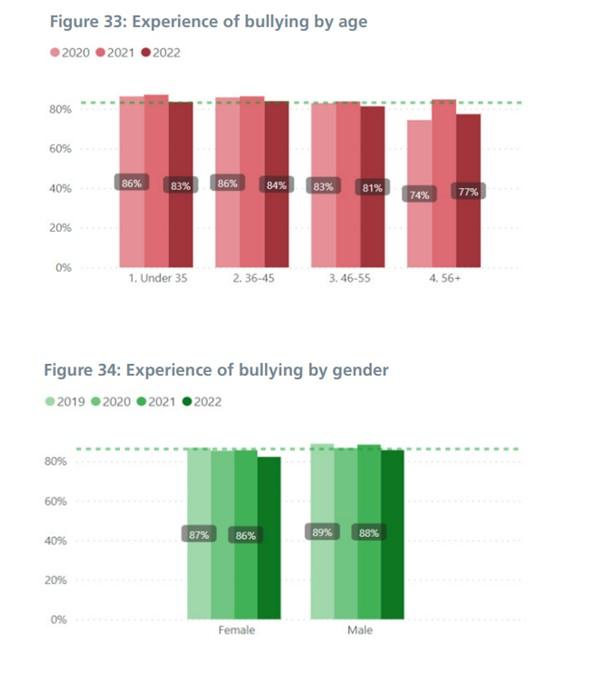
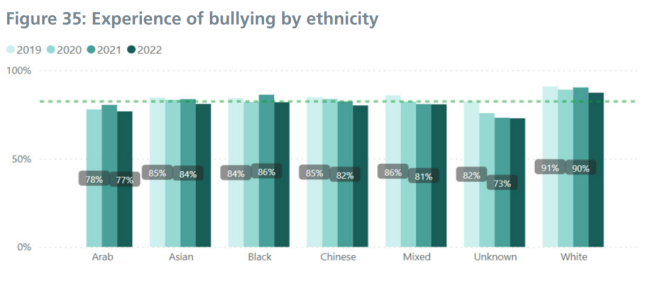
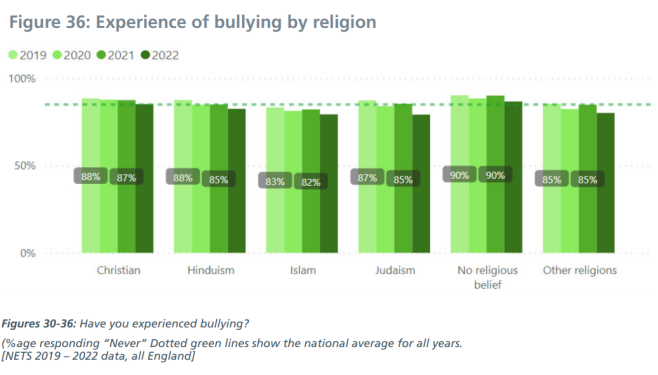
Have You Experienced Bullying?
The results in this section are from the NETS question “Do you feel you have been bullied or harassed by other staff in this placement?” and show the percentages responding “Never”.
Learners with a disability, those who are bisexual, over 56 years old, and those following non-Christian religions report more frequent bullying and harassment than their peers.
Of the ethnic groups, Arab learners and those of unknown ethnicity report more frequent bullying and harassment. White learners are noticeably less affected by bullying, as are those who don’t hold specific religious beliefs.
Bullying of any kind at work is unacceptable: the UK Government website includes advice from ACAS for employers on preventing or dealing with bullying and harassment. https://www.gov.uk/workplace-bullying-and-harassment
NETS Discussion
The NETS data displayed represents the views of all learners, although the majority (61.5%) of replies come from Postgraduate Doctors in Training.
The trend analysis does show that good training can be delivered in urban and rural settings.
This data shows high levels of good quality training and supervision for all ethnic groups. Although not statistically significant, the levels of satisfaction are higher in certain ethnicities. It is also reassuring to see that all ethnic groups feel colleagues are supportive.
Some of the data was collected during the COVID pandemic and it appears that those with a disability may have had a drop off in their educational experience in this time.
No learner should experience discrimination or bullying. This data does show that some groups with protected characteristics are more likely to face discrimination.
Further analysis of all the characteristics may reveal a group who may require targeted support and intervention.
Postgraduate Deans and their Quality teams will look at this data for their regions and their programmes and put in place relevant actions as part of their Quality Improvement Plans to ensure continuous improvement in EDI issues for all learners.
HEE Provider Self-Assessment
The NHS Education Contract requires all placement providers to provide regular and routine assurance to HEE confirming compliance with the contract and the HEE Quality Framework.
In 2022, we introduced the first multi-professional and nationally consistent provider self-assessment. The assessment questions are focused on the six HEE Quality Framework domains and NHS Education Contract key performance indicators.
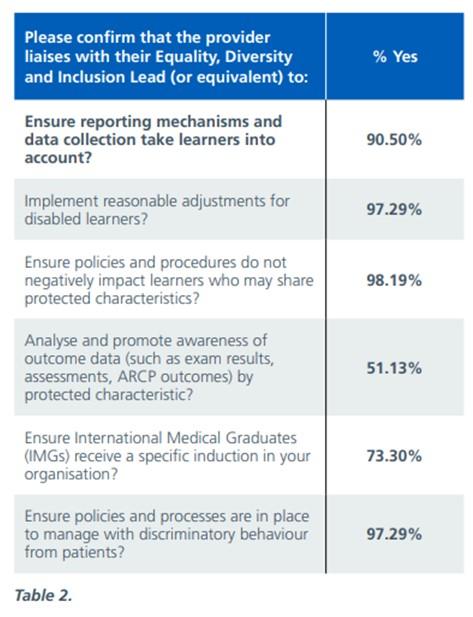
As part of work to eliminate inequalities in education and training, we included six specific questions in the inaugural HEE Provider Self-Assessment.
The NETS also includes specific questions to measure the learner perspective of equality, diversity and inclusion in their placement organisation. The most recent NETS launched during the provider self-assessment window in October 2022 and closed on 30 November 2022.
When asked ‘Have you experienced discrimination by patients?’, 15% of learners responded to confirm that they had experienced discrimination by patients in their current placement. Only 18% of learners reported this experience and just 14% felt that the organisation resolved their concern.
The provider self-assessment returns confirm that over 97% of providers have policies and processes in place to manage discriminatory behaviour from patients. Compared with just 18% of learners reporting their experience, this may suggest an area of improvement in how the relevant policies and processes are signposted to learners.
Consideration may be required to ensure that doctors and dentists moving into training posts in new organisations are aware of how to raise a concern. Whilst the existence of a policy is important, it doesn’t always ensure delivery and effectiveness. We will, next year consider in more detail the impact of policies relating to EDI those listed in our self-assessment and their impact on outcomes.